cond
TREB Announced January, 2019 Market Stats
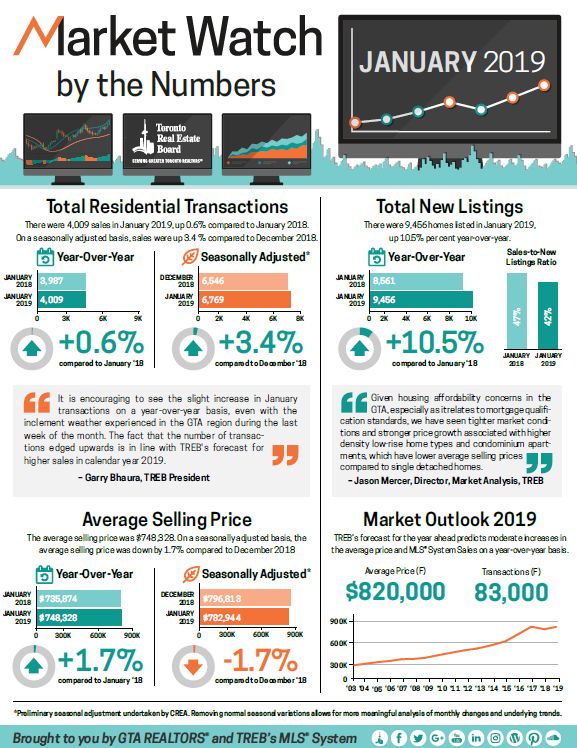
TREB President Garry Bhaura announced that Greater Toronto Area REALTORS® reported 4,009 home sales through TREB’s MLS® in January 2019 – up by 0.6 per cent compared to January 2018. On a preliminary seasonally adjusted basis, sales were up by 3.4 per cent compared to December, 2018.
“It is encouraging to see the slight increase in January transactions on a year-over-year basis, even with the inclement weather experienced in the GTA region during the last week of the month. The fact that the number of transactions edged upwards is in line with TREB’s forecast for higher sales in calendar year 2019,” said Mr. Bhaura.
The MLS® HPI Composite Benchmark price was up by 2.7 per cent compared to January 2018. The condominium apartment market segment continued to lead the way in terms of price growth. The average selling price was up by 1.7 per cent on a year-over-year basis. After preliminary seasonal adjustment, the average selling price edged lower compared to December 2018.
“Market conditions in January, as represented by the relationship between sales and listings, continued to support moderate year-over-year price increases, regardless of the price measure considered. Given housing affordability concerns in the GTA, especially as it relates to mortgage qualification standards, we have seen tighter market conditions and stronger price growth associated with higher density low-rise home types and condominium apartments, which have lower average selling prices compared to single detached homes,” said Jason Mercer, TREB’s Director of Market Analysis and Service Channels.
| Summary of TREB MLS® Sales and Average Price January 1 – 31, 2019 | ||||||
| 2019 | 2018 | |||||
| Sales | Average Price | New Listings | Sales | Average Price | New Listings | |
| City of Toronto (“416”) | 1,422 | 777,674 | 3,144 | 1,509 | 767,394 | 2,769 |
| Rest of GTA (“905”) | 2,587 | 732,197 | 6,312 | 2,478 | 716,679 | 5,792 |
| GTA | 4,009 | 748,328 | 9,456 | 3,987 | 735,874 | 8,561 |
|
Page 4 of 6 TREB MLS® Sales & Average Price by Home Type January 1 – 31, 2019 |
||||||
| Sales | Average Price | |||||
| 416 | 905 | Total | 416 | 905 | Total | |
| Detached | 342 | 1,361 | 1,703 | 1,174,134 | 883,027 | 941,488 |
| Yr./Yr. % Change | -8.6% | 7.0% | 3.5% | -8.8% | 0.9% | -2.8% |
| Semi-Detached | 91 | 248 | 339 | 993,465 | 650,737 | 742,738 |
| Yr./Yr. % Change | -3.2% | -6.1% | -5.3% | 6.1% | 1.8% | 3.6% |
| Townhouse | 141 | 544 | 685 | 797,528 | 600,465 | 641,028 |
| Yr./Yr. % Change | 4.4% | 2.1% | 2.5% | 12.3% | 2.1% | 4.6% |
| Condo Apartment | 840 | 398 | 1,238 | 591,444 | 456,857 | 548,176 |
| Yr./Yr. % Change | -6.3% | 6.7% | -2.4% | 8.8% | 8.2% | 7.9% |
| January 2019 Year-Over-Year Per Cent Change in the MLS® HPI | |||||
| Composite (All Types) | Single-Family Detached | Single-Family Attached | Townhouse | Apartment | |
| TREB Total | 2.70% | -0.04% | 2.26% | 3.49% | 8.04% |
| Halton Region | 2.30% | 3.09% | 4.91% | 0.32% | -4.76% |
| Peel Region | 4.74% | 2.44% | 4.36% | 2.94% | 13.07% |
| City of Toronto | 5.76% | 0.77% | 4.20% | 5.82% | 9.08% |
| York Region | -3.60% | -5.04% | -3.76% | -1.22% | 4.40% |
| Durham Region | 0.39% | -0.17% | 1.18% | 5.91% | -2.84% |
| Orangeville | 2.62% | 2.85% | 1.52% | – | – |
| South Simcoe County1 | -2.14% | -2.17% | -1.90% | – | – |
| Source: Toronto Real Estate Board | |||||
| 1South Simcoe includes Adjala-Tosorontio, Bradford West Gwillimbury, Essa, Innisfil and New Tecumseth | |||||
| January 2019 Outlook Summary Table | ||||||
| 2014 | 2015 | 2016 | 2017 | 2018 | 2019(F) | |
| TREB MLS® System Sales | 92,782 | 101,213 | 113,040 | 92,264 | 77,375 | 83,000 |
| TREB MLS® System Average Price | $566,624 | $622,121 | $729,837 | $822,587 | $787,195 | $820,000 |
—————————————————————————————————————————–
————————————————————————————————————————
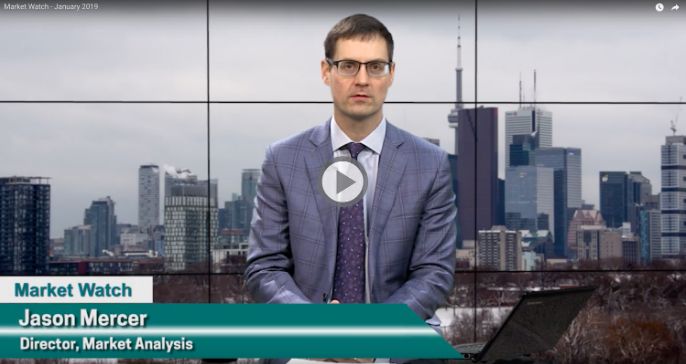
TREB January, 2019 Market Analysis Video
Source: Toronto Real Estate Board
Thinking to sell your house or Condo in Central Toronto areas and/or in downtown Toronto areas? Please call, text or email Max Seal, Broker at 647-294-1177. Please visit http://www.TorontoHomesMax.com for a FREE Home Evaluation“.
Thinking to buy a House or Condo in Central Toronto areas and/or in Downtown Toronto areas? please call or text Max Seal, Broker at 647-294-1177 to buy your dream home or Condo. I offer you a 30-min “FREE buyer’s consultation” with NO obligation.
Please visit my website http://www.centraltorontorealestate.com/ to find out available homes and Condos for sale in Central Toronto areas and/or in downtown Toronto areas.
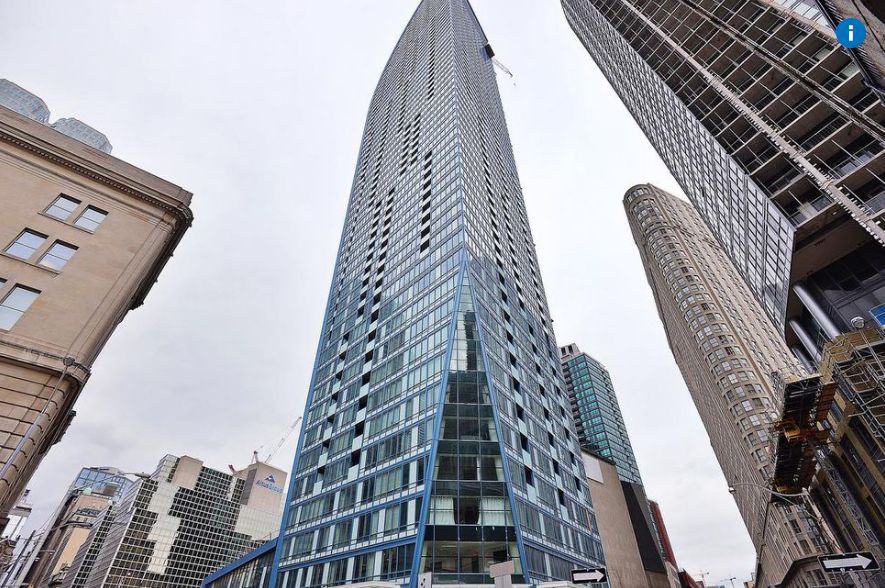
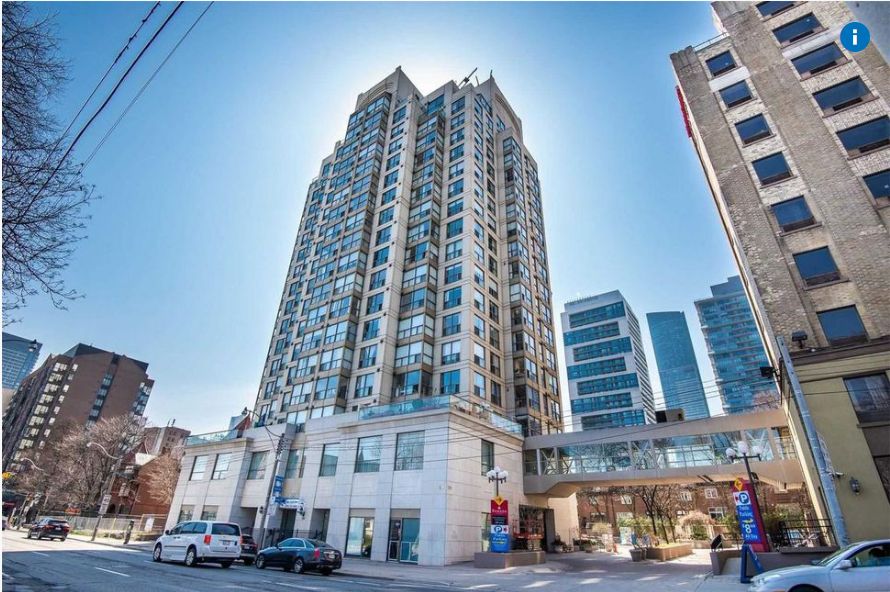
This Toronto housing market may be a better time for “Move-up”, “Move-down” or “Empty-nester” Sellers and Buyers. Want a “Market Update” of your home in 2018? Please click the image below or call or text Max Seal, Broker at 647-294-1177 or send an email.




Leave a Reply